Abstract
It is widely accepted that black holes with masses greater than a million solar masses (M⊙) lurk at the centres of massive galaxies. The origins of such ‘supermassive’ black holes (SMBHs) remain unknown, although those of stellar-mass black holes are well understood. One possible scenario is that intermediate-mass black holes (IMBHs), which are formed by the runaway coalescence of stars in young compact star clusters, merge at the centre of a galaxy to form a SMBH. Although many candidates for IMBHs have been proposed, none is accepted as definitive. Recently, we discovered a peculiar molecular cloud, CO–0.40–0.22, with an extremely broad velocity width, near the centre of our Milky Way galaxy. Based on the careful analysis of gas kinematics, we concluded that a compact object with a mass of about 105M⊙ is lurking in this cloud. Here we report the detection of a point-like continuum source as well as a compact gas clump near the centre of CO–0.40–0.22. This point-like continuum source (CO–0.40–0.22*) has a wide-band spectrum consistent with 1/500 of the Galactic SMBH (Sgr A*) in luminosity. Numerical simulations around a point-like massive object reproduce the kinematics of dense molecular gas well, which suggests that CO–0.40–0.22* is one of the most promising candidates for an intermediate-mass black hole.
The object CO–0.40–0.22 is a compact cloud (~5 pc) with an extremely broad velocity width (~100 km s−1) and very high intensity ratio (≥1.5) for CO J = 3–2/J = 1–0 detected at a projected distance of ~60 pc away from the Galactic nucleus5. It belongs to a peculiar category of molecular clouds called high-velocity compact clouds (HVCCs) that were originally identified in the CO J = 1–0 survey data. The CO–0.40–0.22 cloud is the only dense cloud with a negative velocity detected in the HCN J = 4–3 line within the 0.3° × 0.3° area including it. It has a continuous and roughly straight entity in the position–velocity maps, seeming not to be an aggregate of unrelated clouds with narrower velocity widths. The kinematical structure of CO–0.40–0.22 can be explained as being due to a gravitational kick experienced by the molecular cloud caused by an invisible compact object with a mass of about 105M⊙. The compactness and absence of a counterpart at other wavelengths suggest that this massive object is an inactive IMBH, which is not currently accreting matter. This is the second-largest black hole candidate in the Milky Way galaxy after Sgr A*, as well as the second IMBH candidate in the Galaxy after that in the nuclear subcluster IRS13E (MBH ≈ 1,300M⊙).
Observations with the Atacama Large Millimeter/submillimeter Array (ALMA) band 6 towards CO–0.40–0.22 have provided high-resolution HCN J = 3–2 (265.9 GHz) and CO J = 2–1 (230.5 GHz) images. Dense molecular gas traced by HCN J = 3–2 emission seems to concentrate near the centre of CO–0.40–0.22, as previously determined by the coarse-resolution HCN J = 4–3 map from the Atacama Submillimeter Telescope Experiment (ASTE) (Fig. 1a). The displacement of 0.2 pc from the centre is within the ASTE beamwidth (22″ = 0.9 pc). This dense gas clump is very compact (~0.3 pc) and has a broad velocity width (~100 km s−1). We also see about 20 rather faint clumps. These faint clumps and the central dense clump occupy around 10% of the field of view. The faint clumps have velocity widths less than 20 km s−1. Thus, the chance probability of their alignment over a width of about 100 km s−1 is less than (0.1/(100/20))100/20 = 10−8.5. The main body of the central clump appears at line-of-sight velocities from −80 to −40 km s−1 with respect to the local standard of rest (LSR), being associated with high-velocity components that reach VLSR = −105 and −5 km s−1 (Fig. 2). It is slightly elongated in roughly the same direction as the major axis of CO–0.40–0.22, with a steep velocity gradient from southeast to northwest. The mass of the clump was estimated from the HCN J = 3–2 integrated intensity to be 40M⊙, according to an excitation model at the kinetic temperature Tk = 60 K and number density n(H2) = 106.5 cm−3. On the other hand, the size parameter S = 0.15 pc and velocity dispersion σV = 22 km s−1 give a virial theorem mass of Mvir ≈ 4.1 × 10³M⊙, which indicates that the clump must not be bound by its self-gravity.
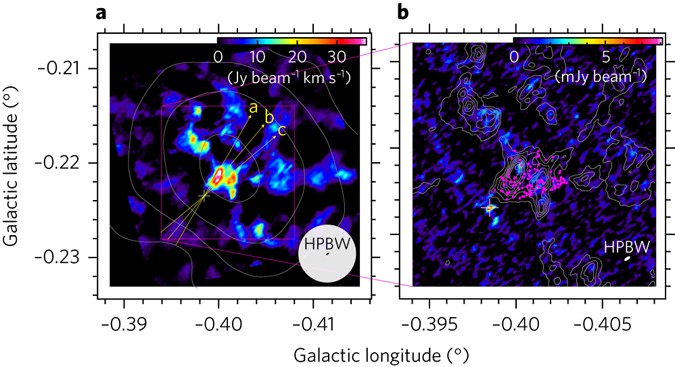
a, Colour map of HCN J = 3–2 emission integrated over V LSR = −110–0 km s−1. The white contours show the same map of HCN J = 4–3 emission obtained with the ASTE 10-m telescope. The contour levels are 50, 100, 200 and 400 K km s−1. The half-power beam widths (HPBWs) of ASTE and ALMA are also presented by a white filled circle and black filled ellipse, respectively. Yellow arrows indicate the lines along which position-velocity slices are made (Fig. 2), and the white cross shows the location of CO–0.40–0.22*. b, Zoomed-in images of HCN J = 3–2 velocity-integrated emission (contours) and 266-GHz continuum emission (colour). The contour interval is 5 Jy beam−1 km s−1. The white filled ellipse shows the ALMA beamsize. Magenta dots show the loci of cloud particles in the gravitational kick model at t = 7.2 × 10⁵ yr
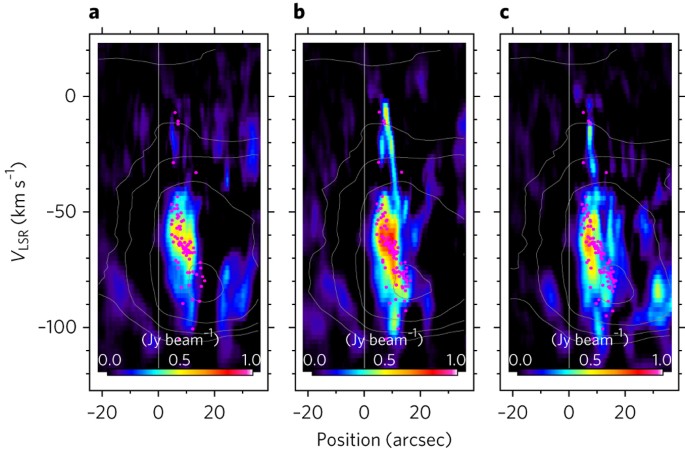
a–c, Position–velocity maps corresponding to the yellow arrows in Fig. 1alabelled a, b and c, respectively. Magenta dots show the loci of cloud particles in the gravitational kick model projected to each position–velocity plane. The white contours show the same maps of HCN J = 4–3 emission obtained with the ASTE. From innermost to outermost the contour levels are 2, 4, 8 and 16 K, and a fifth contour near the upper bound in each panel also shows 2 K, which is another cloud at V LSR ~ 20 km s–1. The vertical solid line in each panel describes the position of CO–0.40–0.22*.
Near to the compact dense gas clump, we detected a point-like continuum source (Fig. 1b). It is located at (l, b)=(−0.3983°, −0.2235°) in Galactic coordinates. Its size and shape coincide with those of the primary beam of our ALMA observations (1.35″ × 0.55″ at 266 GHz). This point-like source (CO–0.40–0.22*) is prominent in both the 231 and 266 GHz images at precisely the same position with flux densities of 8.38 ± 0.34 and 9.91 ± 0.74 mJy, respectively. These flux densities provide a millimetre-wave luminosity of νL ν ≈ 1032.3 erg s−1 at a distance of 8.3 kpc (ref. ). The object CO–0.40–0.22* was the only significant source within the 80″ diameter field of view.
The spectral index at 231/266 GHz is α = 1.18 ± 0.65, which indicates an inverted non-thermal spectrum or a thermal spectrum near the peak. A least-squares fit to the fluxes at 231 and 266 GHz by the Planck function gives T ≈ 9 K. This temperature is far lower than dust temperatures in protoplanetary disks and even lower than the typical dust temperature in the central molecular zone of our Galaxy (Td = 21 ± 2 K). Alternatively, a background submillimetre galaxy at high redshift may show a millimetre-wave spectrum similar to CO–0.40–0.22*. However, the chance probability of a submillimetre galaxy with a flux greater than 10 mJy within a 10″ diameter circle is estimated to be only about 0.1%, based on the observed number density of such objects. Thus, the thermal origin of millimetre-wave emission from CO–0.40–0.22* is implausible. Rather, it may be an inverted non-thermal (power-law) spectrum like that of Sgr A*. The inverted spectrum could be due to the absorption. The theoretically steepest synchrotron self-absorbed spectrum has α = 5/2 (ref. ).
What is CO–0.40–0.22*? The observed flux densities correspond to about 1/500 of the Sgr A* luminosity at the same frequency. By inspecting the X-ray data obtained by the XMM Newton observatory, we obtained an upper limit to the 1–7 keV flux density of CO–0.40–0.22*: 1.4 × 10⁻¹⁴ erg cm−2 s−1(approximately 1 nJy). This is also consistent with the 1:500 scale spectrum of Sgr A* (Fig. 3). All of the observed facts indicate it is possible that millimetre-wave emission from CO–0.40–0.22* comes from the near vicinity of an IMBH.
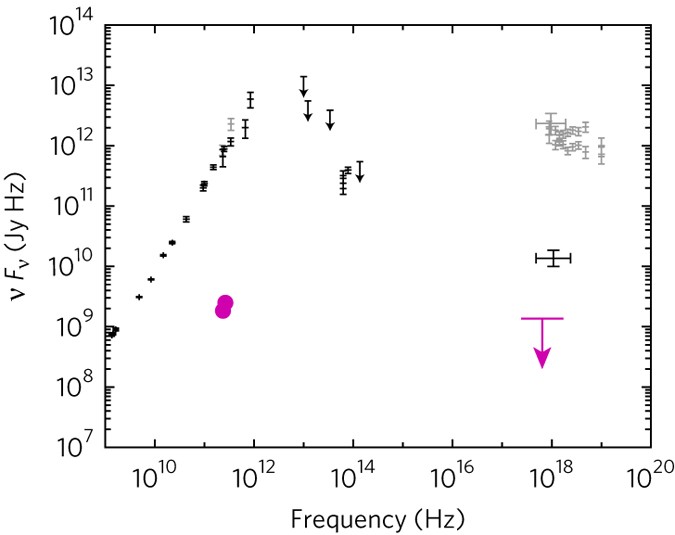
Wide-band spectrum of Sgr A* in the quiescent (black) and flare-up (grey) states. Error bars are 1σ uncertainties. The magenta filled circles show the 231-GHz and 266-GHz fluxes of CO–0.40–0.22*. Uncertainties are smaller than the size of the symbol. The magenta bar with a downward arrow denotes the 3σ upper limit to the X-ray flux.
We now have the accurate position of the IMBH candidate. We accordingly refined the gravitational kick model for CO–0.40–0.22. We basically followed the parameters used in the previous paper4 except for the inclination of the orbital plane (i = 70° with respect to the line of sight). In the new simulation, we included self-gravity within the model cloud and set it initially virialized. We placed a point-like mass of 105M⊙ at the centre and a spherical cloud at (x, y) = (9.8 pc, −0.65 pc) in the coordinates defined by the orbital plane (see Fig. 4 for the configuration). The origin was set to the centre of gravity. The model cloud was then thrown with an initial velocity of (v x , v y) = (−8.19 km s−1, 0.4 km s−1). The simulated cloud, just after the pericentre passage, reproduced the bulk kinematics of CO–0.40–0.22 well. It also reproduced the spatial velocity behaviour of the compact dense gas clump very well (Fig. 1b, Fig. 2).
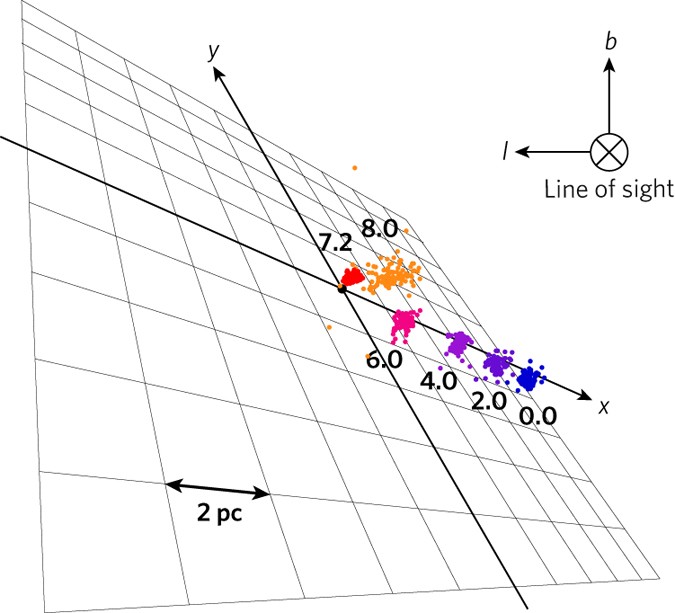
Geometric configuration of the model cloud and a 105 M ⊙ point-like mass drawn in perspective from a distance of 30 pc. The horizontal direction is the Galactic longitude (l) and the vertical direction is the Galactic latitude (b). The orbital plane is displayed by xy axes. The loci of cloud particles are illustrated at six time slices: t = 0, 2, 4, 6, 7.2 and 8.0 (unit: 105 yr). 105 particles that overlap with the HCN J = 3–2 clump in the plane of the sky at t = 7.2 × 10⁵ yr (Fig. 1b) are traced.
Where did the IMBH come from? Runaway stellar mergers at centres of dense star clusters can produce massive black holes. However, the ratio of the black hole mass (MBH) to the parent cluster mass (Mc) is typically 1/1,000 (refs), which is similar to the ratio between a SMBH and the Galactic bulge. According to this MBH–Mc relation, a 105M⊙ black hole requires a parent cluster of about 108M⊙, which is categorized in the upper hierarchy: that is, as a dwarf galaxy rather than a star cluster. Black holes with masses of less than a million solar masses have been suggested in the nuclei of nearby dwarf galaxies. It is believed that large galaxies such as the Milky Way grew to their present form by cannibalizing their smaller neighbours. In fact, a minor merger event ~200 Myr ago was suggested by infrared stellar populations in the central kiloparsec (ref. ). So far, more than 50 satellite galaxies have been discovered within 420 kpc from the Milky Way. We suggest that CO–0.40–0.22* used to be the nucleus of a dwarf galaxy that was cannibalized by our Milky Way.
The compact radio source in HVCC CO–0.40–0.22 strongly supports our theory that a gravitational kick by an IMBH is responsible for the extraordinarily broad velocity width of this HVCC. The extreme dimness of CO–0.40–0.22* may inspire the development of new radiatively inefficient accretion flow models. Future multi-wavelength observations and flux variation measurements of CO–0.40–0.22* will elaborate on such models with an isolated massive black hole. They may possibly show phenomena unique to a black hole, such as quasi-periodic oscillations. The case of CO–0.40–0.22 opens a new perspective on the study of other HVCCs, as well as compact high-velocity features in the Galactic disk. Some of them may contain non-luminous black holes. For example, an ultra-high-velocity gas in the W44 supernova remnant is suggested to have been accelerated by the explosion or irruption of a black hole. We recently detected two ultra-compact high-velocity features in the vicinity of the Galactic circumnuclear disk, which also could be driven by the plunge of inactive black holes. Theoretical studies have predicted that 100 million to 1 billion black holes should exist in the Milky Way, although only 60 or so have been identified through observations so far. Further detection of such compact high-velocity features in various environments may increase the number of non-luminous black hole candidate and thereby increase targets to search for evidential proof of general relativity. This would make a considerable contribution to the progress of modern physics.
Methods
ALMA observations and data reduction
Our cycle 1 ALMA observations (ALMA/2012.1.00940.S) in band 6 were taken on 2013 July 8, October 6–7; 2014 April 13, May 11, December 29; and 2015 January 22. The 230.5-GHz (CO J = 2–1) data were obtained with seven 7-m antennas and 39 12-m antennas, and the 265.9-GHz (HCN J = 3–2) data were obtained with eight or ten 7-m antennas and 30 or 31 12-m antennas. For CO–0.40–0.22 observations, we configured the correlators to the 937.5-MHz bandwidth (3,840 channels) mode. Each target line was centred in one spectral window. Amplitude calibration was based on Mars, Titan, Neptune and J2232 + 117. We used J1924–2914, J1517–2422, J2427–4206, J1733–1304, J2258–2758 and J1517–2422 as bandpass calibrators. J1744–3116, J2337–0230 and J1745–2900 were used as phase calibrators. Calibrator selections depend on epochs.
We reduced the data with Common Astronomy Software Applications (CASA) version 4.4.0-REL, with the calibration script supplied by the East Asian ALMA Regional Centre. The data were split into line and continuum data sets by using the task uvcontsub(). For spectral line data, we reduced the data with channels from −150 km s−1 to +50 km s−1 with a width of 2 km s−1 and a cell size of 0.2″. We ran the cleaning algorithm with natural weighting. The angular sizes of the cleaned beam full-width at half-maximum are 1.87″ × 1.14″ and 1.52″ × 0.60″, at 230.5 GHz and 265.9 GHz, respectively. The position angles of the beam are 74.7° and 70.6°. For continuum data, we used the 12-m array data only to drop spatially extended emission. We averaged the data over the bandwidths and cleaned with Briggs weighting. The beam sizes and position angles are 1.71″ × 1.02″, 73.2°, and 1.35″ × 0.55″, 70.2°, at 230.5 GHz and 265.9 GHz, respectively.
N-body simulations
Gravitational N-body simulations were performed to reproduce the distribution and kinematics of dense molecular clumps adjacent to CO–0.40–0.22* by the gravitational kick model. We used the leapfrog method to integrate Newton’s equation of motion. The time step was set to 4.6 × 10³ yr. We set a 105M⊙point-like mass and a spherical cloud of a thousand 1M⊙particles. The cloud is initially virialized, having a Gaussian radial dispersion of 0.2 pc and velocity dispersion of 1.43 km s−1. The cloud was placed at (x, y) = (9.8 pc, −0.65 pc), and then thrown with an initial velocity of (v x , v y ) = (−8.19 km s−1, 0.4 km s−1). The origin of the xy plane was set to the centre of gravity, which is almost coincident with the 105M⊙ point-like mass.
Geometrical parameters were chosen basically in accordance with those of the previous paper4. The y-axis was originally set parallel to the line of sight, then the xy plane was rotated about the z-axis by 45°. The position angle of the orbital plane was set to 41.6°. We set the inclination (i) of the orbital plane to 70.0° to reproduce the displacement of ~0.3 pc between the main HCN J = 3–2 clump and CO–0.40–0.22*. The line-of-sight velocity of the centre of gravity was set to VLSR = −120 km s−1. The latter two parameters were i = 90.0° and VLSR = −110 km s−1 in the previous paper.
Data availability
The data that support the plots within this paper and other findings of this study are available from the corresponding author upon reasonable request. Data from our ALMA cycle 1 observations (ALMA/2012.1.00940.S) can be obtained from the ALMA Science Archive Query, http://almascience.nao.ac.jp/aq/.
For more technological trending news, research and informations click on www.bondempires.blogspot.com
No comments:
Post a Comment